Inhibition, crystal structures, and in-solution oligomeric structure of aldehyde dehydrogenase 9A1.

Wyatt JW, Korasick DA, Qureshi IA, Campbell AC, Gates KS, Tanner JJ, Arch Biochem Biophys :108477 (2020) Europe PMC

SASDHW5 – Human 4-trimethylaminobutyraldehyde dehydrogenase (ALDH9A1) at 2.5 mg/mL

4-trimethylaminobutyraldehyde dehydrogenase
MWexperimental 182 kDa
MWexpected 215 kDa
VPorod 240 nm3
log I(s) 1.66×101 1.66×100 1.66×10⁻¹ 1.66×10⁻²
4-trimethylaminobutyraldehyde dehydrogenase small angle scattering data  s, nm-1
ln I(s)
4-trimethylaminobutyraldehyde dehydrogenase Guinier plot ln 1.67×101 Rg: 3.8 nm 0 (3.8 nm)-2 s2
(sRg)2I(s)/I(0)
4-trimethylaminobutyraldehyde dehydrogenase Kratky plot 1.104 0 3 sRg
p(r)
4-trimethylaminobutyraldehyde dehydrogenase pair distance distribution function Rg: 3.7 nm 0 Dmax: 10.8 nm

Data validation


Fits and models


log I(s)
 s, nm-1
4-trimethylaminobutyraldehyde dehydrogenase OTHER model

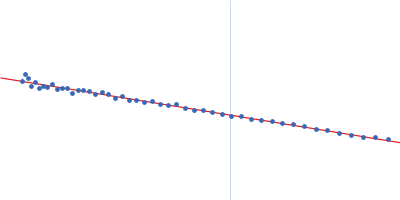
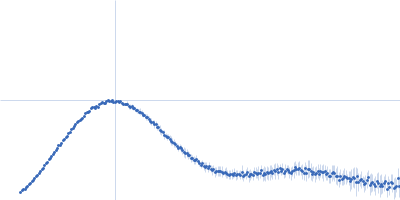
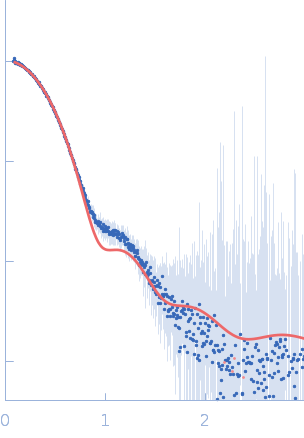
Synchrotron SAXS data from solutions of 4-trimethylaminobutyraldehyde dehydrogenase in 50 mM HEPES, 600 mM NaCl, 2% (v/v) glycerol, 1 mM DTT, 1 mM NAD+, pH 8 were collected on the 12.3.1 (SIBYLS) beam line at the Advanced Light Source (ALS; Berkeley, CA, USA) using a Pilatus3 X 2M detector at a sample-detector distance of 2 m and at a wavelength of λ = 0.127 nm (I(s) vs s, where s = 4πsinθ/λ, and 2θ is the scattering angle). One solute concentration of 2.50 mg/ml was measured at 10°C using a 0.2 s exposure time. The data were normalized to the intensity of the transmitted beam and radially averaged; the scattering of the solvent-blank was subtracted.

Storage temperature = UNKNOWN. Number of frames = UNKNOWN

4-trimethylaminobutyraldehyde dehydrogenase
Mol. type   Protein
Organism   Homo sapiens
Olig. state   Tetramer
Mon. MW   53.7 kDa
 
UniProt   P49189
Sequence   FASTA