Contrasting DNA-binding behaviour by ISL1 and LHX3 underpins differential gene targeting in neuronal cell specification

Smith N, Wilkinson-White L, Kwan A, Trewhella J, Matthews J, Journal of Structural Biology: X :100043 (2020) DOI

SASDJJ9 – M100 DNA oligonucleotide bound to the protein fusion of Insulin gene enhancer protein Isl-1 homeodomain/LIM-interaction domain (Isl1-HDLID) and LIM/homeobox protein Lhx3 LIM-homeodomain (Lhx3-LIMHD): M100 + 2HDLL

M100 oligonucleotide
Insulin gene enhancer protein ISL-1
LIM/homeobox protein Lhx3
MWI(0) 51 kDa
MWexpected 50 kDa
VPorod 70 nm3
log I(s) 3.47×10⁻² 3.47×10⁻³ 3.47×10⁻⁴ 3.47×10⁻⁵
M100 oligonucleotide Insulin gene enhancer protein ISL-1 LIM/homeobox protein Lhx3 small angle scattering data  s, nm-1
ln I(s)
M100 oligonucleotide Insulin gene enhancer protein ISL-1 LIM/homeobox protein Lhx3 Guinier plot ln 3.47×10⁻² Rg: 3.6 nm 0 (3.6 nm)-2 s2
(sRg)2I(s)/I(0)
M100 oligonucleotide Insulin gene enhancer protein ISL-1 LIM/homeobox protein Lhx3 Kratky plot 1.104 0 3 sRg
p(r)
M100 oligonucleotide Insulin gene enhancer protein ISL-1 LIM/homeobox protein Lhx3 pair distance distribution function Rg: 3.7 nm 0 Dmax: 14 nm

Data validation


Fits and models


log I(s)
 s, nm-1
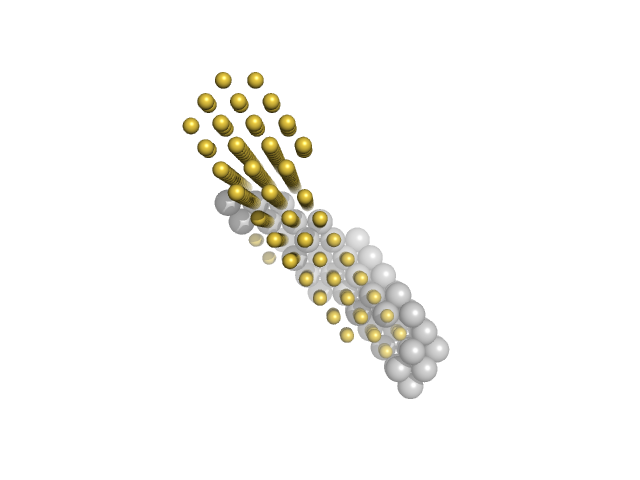
M100 oligonucleotide Insulin gene enhancer protein ISL-1 LIM/homeobox protein Lhx3 MONSA model

log I(s)
 s, nm-1
M100 oligonucleotide Insulin gene enhancer protein ISL-1 LIM/homeobox protein Lhx3 MONSA model

log I(s)
 s, nm-1
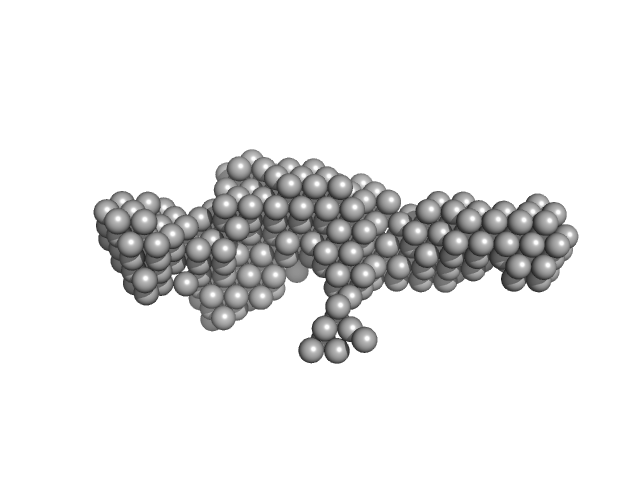
M100 oligonucleotide Insulin gene enhancer protein ISL-1 LIM/homeobox protein Lhx3 DAMMIN model

Synchrotron SAXS data from solutions of 2HDLL (Isl1-HDLID fused to Lhx3-LIMHD) + M100 in 20 mM sodium phosphate buffer, 100 mM NaCl, 1 mM DTT, pH 7.4 were collected on the SAXS/WAXS beam line at the Australian Synchrotron (Melbourne, Australia) using a Pilatus 1M detector at a sample-detector distance of 0.9 m and at a wavelength of λ = 0.108 nm (I(s) vs s, where s = 4πsinθ/λ, and 2θ is the scattering angle). One solute concentration of 0.69 mg/ml was measured at 27°C. 32 successive 1 second frames were collected. The data were normalized to the intensity of the transmitted beam and radially averaged; the scattering of the solvent-blank was subtracted.

Storage temperature = UNKNOWN

M100 oligonucleotide (M100)
Mol. type   DNA
Olig. state   Monomer
Mon. MW   12.4 kDa
Sequence   FASTA
 
Insulin gene enhancer protein ISL-1 (Isl1)
Mol. type   Protein
Organism   Mus musculus
Olig. state   Monomer
Mon. MW   14.0 kDa
 
UniProt   P61372 (179-291)
Sequence   FASTA
 
LIM/homeobox protein Lhx3 (Lhx3)
Mol. type   Protein
Organism   Mus musculus
Olig. state   Monomer
Mon. MW   23.2 kDa
 
UniProt   P50481 (28-227)
Sequence   FASTA