Insulin Binding to the Analytical Antibody Sandwich Pair OXI ‐005 and HUI ‐018 – Epitope Mapping and Binding Properties

Johansson E, Wu X, Yu B, Yang Z, Cao Z, Wiberg C, Jeppesen C, Poulsen F, Protein Science (2020) DOI

SASDJZ3 – Immunoglobulin HUI-018 Fab in complex with human insulin at high concentration

Insulin (Insulin B chain and Insulin A chain)
HUI-018 Fab
MWI(0) 202 kDa
MWexpected 53 kDa
VPorod 105 nm3
log I(s) 4.85×10⁻¹ 4.85×10⁻² 4.85×10⁻³ 4.85×10⁻⁴
Insulin (Insulin B chain and Insulin A chain) HUI-018 Fab small angle scattering data  s, nm-1
ln I(s)
Insulin (Insulin B chain and Insulin A chain) HUI-018 Fab Guinier plot ln 4.85×10⁻¹ Rg: 3.7 nm 0 (3.7 nm)-2 s2
(sRg)2I(s)/I(0)
Insulin (Insulin B chain and Insulin A chain) HUI-018 Fab Kratky plot 1.104 0 3 sRg
p(r)
Insulin (Insulin B chain and Insulin A chain) HUI-018 Fab pair distance distribution function Rg: 3.9 nm 0 Dmax: 13.4 nm

Data validation


Fits and models


log I(s)
 s, nm-1
Insulin (Insulin B chain and Insulin A chain) HUI-018 Fab OTHER model

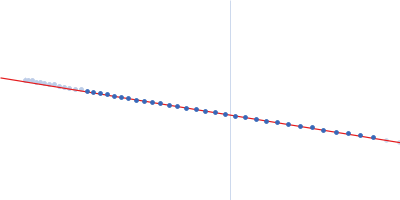
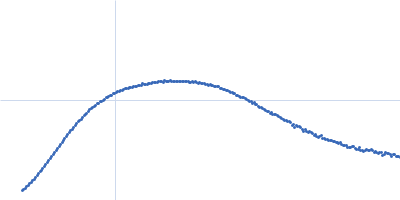
Synchrotron SAXS data from solutions of HUI-018 Fab in complex with human insulin in 20 mM HEPES, 140 mM NaCl, pH 7.5 were collected on the I911-4 beam line at MAX IV (Lund, Sweden) using a Pilatus 1M detector at a wavelength of λ = 0.1 nm (I(s) vs s, where s = 4πsinθ/λ, and 2θ is the scattering angle). One solute concentration of 6.80 mg/ml was measured at 20°C. One 120 second frame was collected. The data were normalized to the intensity of the transmitted beam and radially averaged; the scattering of the solvent-blank was subtracted.

Models represent an oligomeric mixture.

Insulin (Insulin B chain and Insulin A chain) (INS)
Mol. type   Protein
Organism   Homo sapiens
Olig. state   Monomer
Mon. MW   5.8 kDa
 
UniProt   P01308 (25-110)
Sequence   FASTA
 
HUI-018 Fab (HUI-018Fab)
Mol. type   Protein
Organism   Mus musculus
Olig. state   Monomer
Mon. MW   47.5 kDa
Sequence   FASTA