Synchrotron SAXS
data from solutions of
The Fe–S cluster assembly 1 homolog of pigeon (29.3 mg/ml), Total X-ray exposure time : 1min
in
20 mM Tris-HCl, 0.15 M NaCl, 10 mM 3-mercapto-1,2-propanediol, pH 8
were collected
on the
BL-10C beam line
at the Photon Factory (PF), High Energy Accelerator Research Organization (KEK) storage ring
(Tsukuba, Japan)
using a Pilatus3 2M detector
at a sample-detector distance of 3 m and
at a wavelength of λ = 0.155 nm
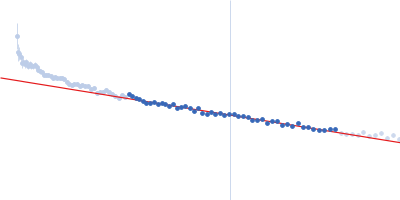
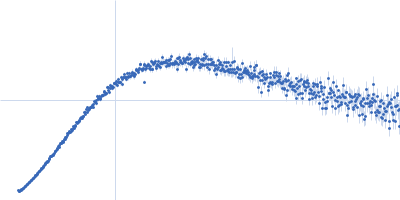
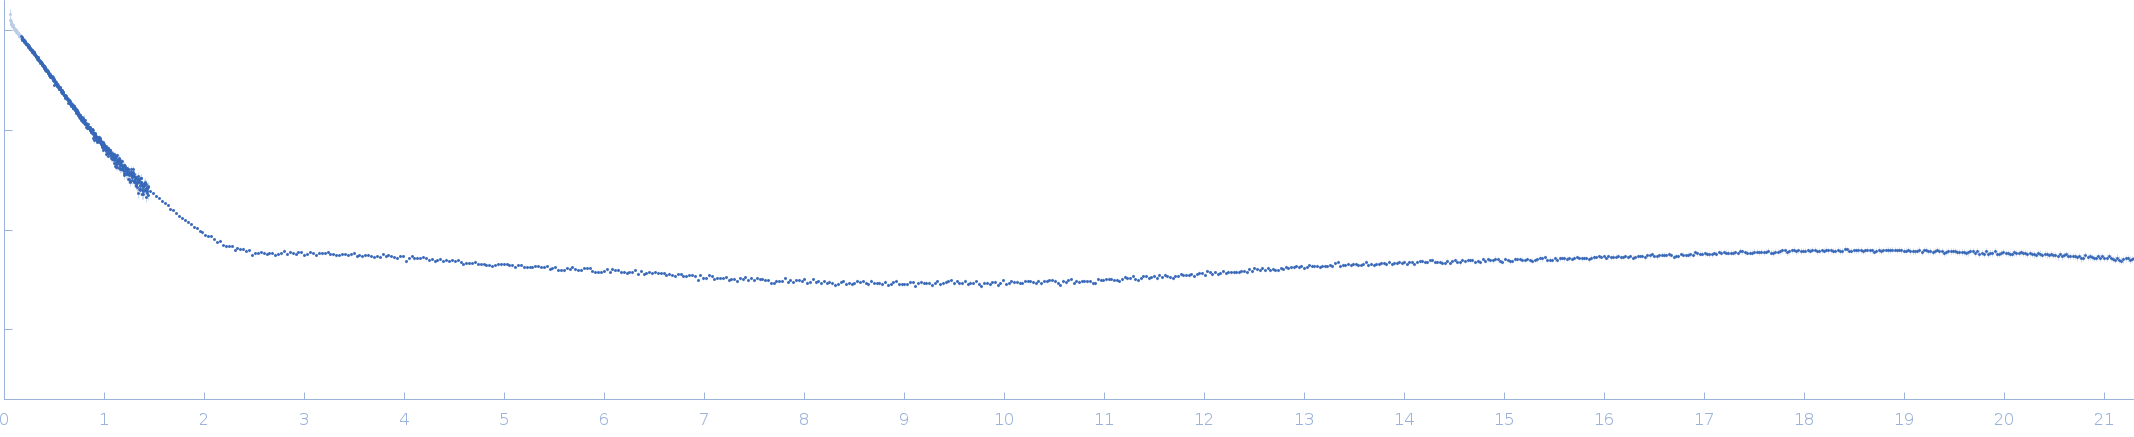
(I(s) vs s, where s = 4πsinθ/λ, and 2θ is the scattering angle).
at 20°C.
One
60 second frame was collected.
The data were normalized to the intensity of the transmitted beam and radially averaged; the scattering of the solvent-blank was subtracted.
The low angle data collected at lower concentration were merged with the highest concentration high angle data to yield the final composite scattering curve.
SAXS/WAXS data were measured at 20°C from a sample at 29.3 mg/ml using two different sample-to-detector distances (0.3 and 3 m), and merged using the program ATSAS 3.0.3.
 s, nm-1