Characterization of synthetic antigen binding fragments targeting Toc75 for the isolation of TOC in A. thaliana and P. sativum

Srinivasan K, Erramilli S, Chakravarthy S, Gonzalez A, Kossiakoff A, Noinaj N, Structure (2023) DOI

SASDR36 – Pisum sativum Toc75 Potra domains

Protein TOC75, chloroplastic
MWexperimental 32 kDa
MWexpected 32 kDa
VPorod 60 nm3
log I(s) 3.17×10⁻⁵ 3.17×10⁻⁶ 3.17×10⁻⁷ 3.17×10⁻⁸
Protein TOC75, chloroplastic small angle scattering data  s, nm-1
ln I(s)
Protein TOC75, chloroplastic Guinier plot ln 3.17×10⁻⁵ Rg: 2.9 nm 0 (2.9 nm)-2 s2
(sRg)2I(s)/I(0)
Protein TOC75, chloroplastic Kratky plot 1.104 0 3 sRg
p(r)
Protein TOC75, chloroplastic pair distance distribution function Rg: 2.9 nm 0 Dmax: 11 nm

Data validation


There are no models related to this curve.

Synchrotron SAXS data from solutions of Pisum sativum Toc75 Potra domains in phosphate buffered saline, pH 7.5 were collected on the BioCAT 18ID beam line at the Advanced Photon Source (APS), Argonne National Laboratory storage ring (Lemont, IL, USA) using a Pilatus3 X 1M detector at a sample-detector distance of 3.7 m and at a wavelength of λ = 0.103 nm 
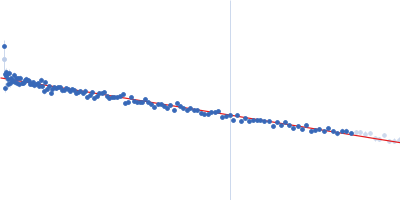
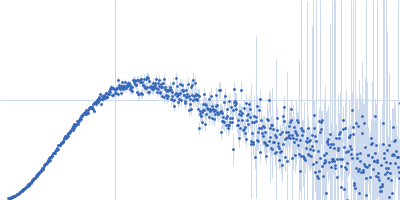
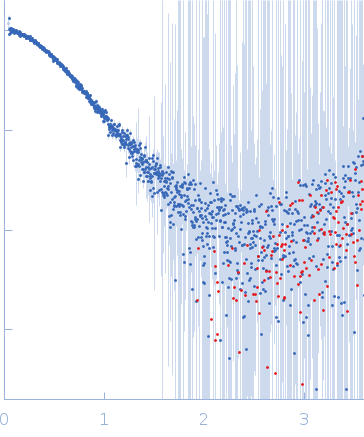
(I(s) vs s, where s = 4πsinθ/λ, and 2θ is the scattering angle). In-line size-exclusion chromatography (SEC) SAS was employed. The SEC parameters were as follows: A sample was injected onto a GE Superdex 200 Increase 10/300 column at 25°C. 11 successive 1 second frames were collected. The data were normalized to the intensity of the transmitted beam and radially averaged; the scattering of the solvent-blank was subtracted.

Sample injection volume = UNKNOWN. Flow rate = UNKNOWN

Protein TOC75, chloroplastic (psToc75)
Mol. type   Protein
Organism   Pisum sativum
Olig. state   Monomer
Mon. MW   31.6 kDa
 
UniProt   Q43715 (163-440)
Sequence   FASTA