Distinct conformational states enable transglutaminase 2 to promote cancer cell survival versus cell death.

Aplin C, Zielinski KA, Pabit S, Ogunribido D, Katt WP, Pollack L, Cerione RA, Milano SK, Commun Biol 7(1):982 (2024) Europe PMC

SASDTS3 – Tissue Transglutaminase + 1 mM GTP

Protein-glutamine gamma-glutamyltransferase 2
MWexperimental 72 kDa
MWexpected 77 kDa
VPorod 115 nm3
log I(s) 1.40×10⁻¹ 1.40×10⁻² 1.40×10⁻³ 1.40×10⁻⁴
Protein-glutamine gamma-glutamyltransferase 2 small angle scattering data  s, nm-1
ln I(s)
Protein-glutamine gamma-glutamyltransferase 2 Guinier plot ln 1.40×10⁻¹ Rg: 3.4 nm 0 (3.4 nm)-2 s2
(sRg)2I(s)/I(0)
Protein-glutamine gamma-glutamyltransferase 2 Kratky plot 1.104 0 3 sRg
Dmax: 17 nm

Data validation


There are no models related to this curve.

Synchrotron SAXS data from solutions of Tissue Transglutaminase + 1 mM GTP in 20 mM HEPES, 100 mM NaCl, 10% glycerol, 1 mM DTT, pH 7.5 were collected on the ID7A1 BioSAXS / HP-Bio Beamline beam line at the Cornell High Energy Synchrotron Source (CHESS) storage ring (Ithaca, NY, USA) using a Eiger 4M detector at a sample-detector distance of 1.7 m and at a wavelength of λ = 0.1103 nm (I(s) vs s, where s = 4πsinθ/λ, and 2θ is the scattering angle). One solute concentration of 2.00 mg/ml was measured. 15 successive 5 second frames were collected. The data were normalized to the intensity of the transmitted beam and radially averaged; the scattering of the solvent-blank was subtracted.

Cell temperature = UNKNOWN. Storage temperature = UNKNOWN
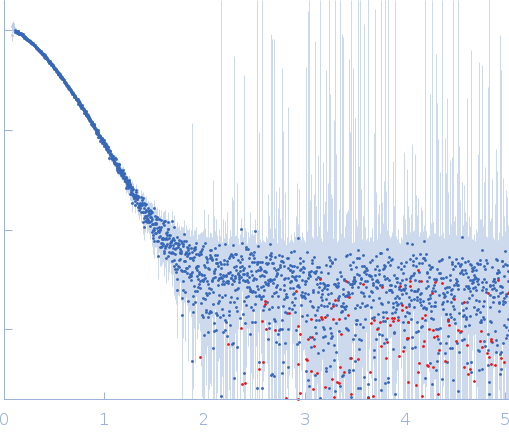
Protein-glutamine gamma-glutamyltransferase 2 (TG2)
Mol. type   Protein
Organism   Homo sapiens
Olig. state   Unknown
Mon. MW   77.3 kDa
 
UniProt   P21980 (1-687)
Sequence   FASTA