|
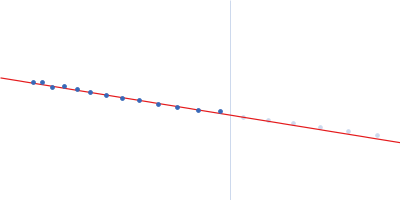
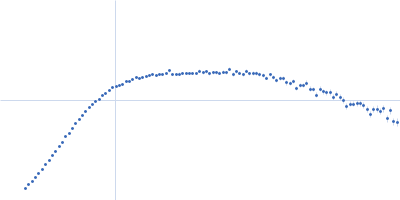
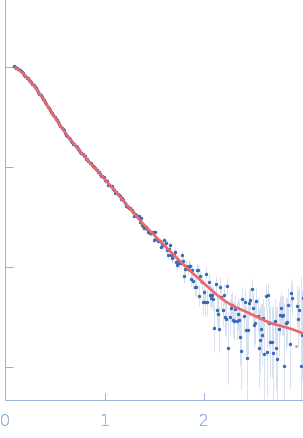
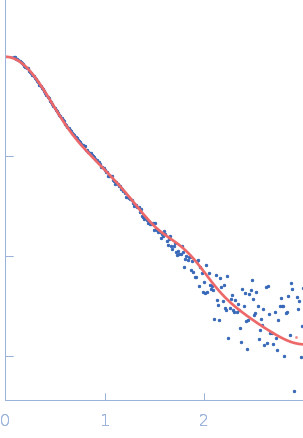
X-ray synchrotron radiation scattering data from the from the Ag43-Fab complex in 25 mM HEPES 150mM NaCl pH 7.0 were collected on the SAXS/WAXS beam line of the Australian Synchrotron (Melbourne, Australia) in a SEC-SAXS with sheath flow configuration using a 2D Photon counting Pilatus 1M-W pixel detector (I(s) vs s, where s = 4π sin θ/λ and 2θ is the scattering angle; λ=0.10332 nm). Approximately 50 uL of a 5.0 mg/ml protein solution was injected onto a S200 Increase 5/150 column at a flow rate of 0.4 ml/min. Three hundred successive 1 second frames were collected during the SEC-SAXS run. The peak of the elution profile occured at ~3 mins after the start of the run, and the protein scattering was taken as the average of 14 frames collected 190-203 seconds after the peak eluted. The concentration range corresponding to the averaged frames was ~0.25 - 1.20 mg/ml, and the average concentration was taken as ~0.59 mg/ml. The buffer was taken as the sum of 50 frames collected between 1-2 mins after the start of the run. The data were normalized to the intensity of the transmitted beam and radially averaged and the scattering of the solvent-blank was subtracted. The models and corresponding fits include those derived from dummy-atom modelling using DAMMIN (top) and CRYSOL using the crystal structure (bottom).
SEC column = UNKNOWN. Sample injection volume = UNKNOWN. Flow rate = UNKNOWN
|
|
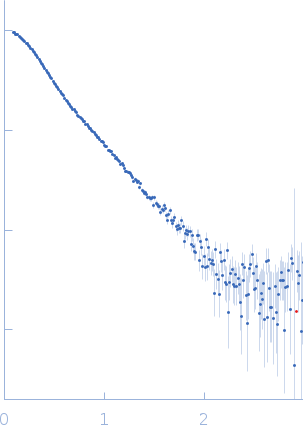 s, nm-1