Saposin Lipid Nanoparticles: A Highly Versatile and Modular Tool for Membrane Protein Research.

Flayhan A, Mertens HDT, Ural-Blimke Y, Martinez Molledo M, Svergun DI, Löw C, Structure 26(2):345-355.e5 (2018) Europe PMC

SASDC37 – Saposin nanoparticle (SapNP) SapA:SoyPI

saposin-a
L-α-phosphatidylinositol (soy)
MWexperimental 38 kDa
MWexpected 31 kDa
VPorod 68 nm3
log I(s) 4.33×10⁴ 4.33×10³ 4.33×10² 4.33×101
saposin-a L-α-phosphatidylinositol (soy) small angle scattering data  s, nm-1
ln I(s)
saposin-a L-α-phosphatidylinositol (soy) Guinier plot ln 4.34×10⁴ Rg: 3.6 nm 0 (3.6 nm)-2 s2
(sRg)2I(s)/I(0)
saposin-a L-α-phosphatidylinositol (soy) Kratky plot 1.104 0 3 sRg
p(r)
saposin-a L-α-phosphatidylinositol (soy) pair distance distribution function Rg: 3.4 nm 0 Dmax: 8.5 nm

Data validation


Fits and models


log I(s)
 s, nm-1
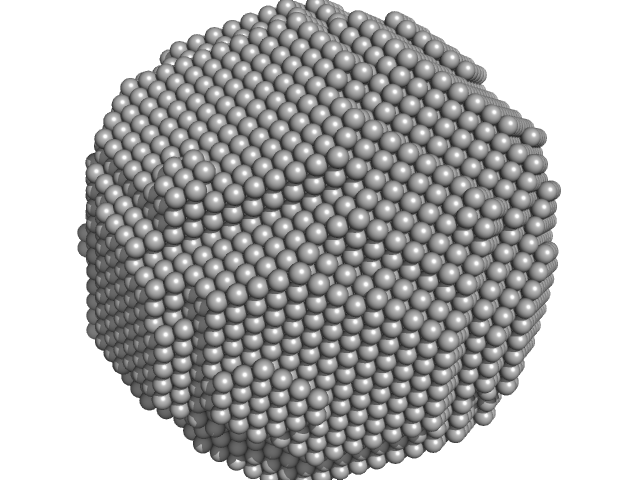
saposin-a L-α-phosphatidylinositol (soy) DAMMIF model

Synchrotron SAXS data from solutions of Saposin nanoparticle (SapNP) SapA:SoyPI in PBS, pH 7.4 were collected on the EMBL P12 beam line at the PETRA III storage ring (DESY; Hamburg, Germany) using a Pilatus 2M detector at a sample-detector distance of 3.1 m and at a wavelength of λ = 0.124 nm (I(s) vs s, where s = 4πsinθ/λ, and 2θ is the scattering angle). at 10°C. 20 successive 0.050 second frames were collected. The data were normalized to the intensity of the transmitted beam and radially averaged; the scattering of the solvent-blank was subtracted. The low angle data collected at lower concentrations were extrapolated to infinite dilution and merged with the higher concentration data to yield the final composite scattering curve.

Concentration min = UNKNOWN. Concentration max = UNKNOWN

saposin-a (sapA)
Mol. type   Protein
Organism   Homo sapiens
Olig. state   Monomer
Mon. MW   9.1 kDa
 
UniProt   P07602 (60-140)
Sequence   FASTA
 
L-α-phosphatidylinositol (soy) (soyPI)
Mol. type   Other
Organism   Glycine max
Olig. state   Other
Mon. MW   0.9 kDa