|
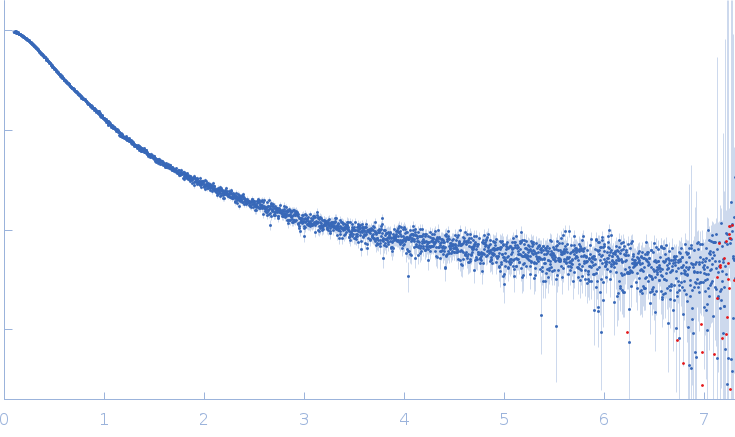
Synchrotron SAXS data from solutions of phloem-associated RNA chaperone-like protein (PARCL) in 50 mM HEPES, 150 mM NaCl, 5 mM DTT, pH 7.5 were collected on the EMBL P12 beam line at PETRA III (DESY, Hamburg, Germany) using a Pilatus 6M detector at a sample-detector distance of 3 m and at a wavelength of λ = 0.124 nm (I(s) vs s, where s = 4πsinθ/λ, and 2θ is the scattering angle). In-line size-exclusion chromatography (SEC) SAS was employed. The SEC parameters were as follows: A 35.00 μl sample at 5 mg/ml was injected at a 0.30 ml/min flow rate onto a GE Superdex 75 Increase 5/150 column at 20°C. 170 successive 0.250 second frames were collected. The data were normalized to the intensity of the transmitted beam and radially averaged; the scattering of the solvent-blank was subtracted.
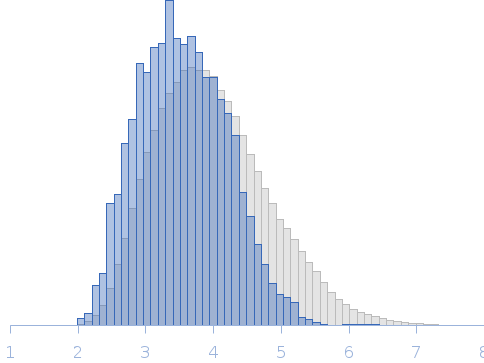
The data displayed in this entry was derived from the averaged scattering profiles obtained from two SEC-SAXS runs. The the Rg correlation through the sample elution peak from the individual, background-subtracted data frames, (as assessed suing CHROMIXS), is provided in the full entry zip archive. The experimental molecular weight estimate was determined from multi-angle laser light scattering and refractive index measurements (refer to full entry zip archive). The p(r) profile maybe interpreted as the vector length distribution of the volume-fraction weighted contribution of each individual component of the protein ensemble. The resulting protein ensemble is represented by the Rg distribution obtained from Ensemble Optimization Method (EOM) and by the image displaying the spatial alignment of individual ensemble model representatives (ribbon/string) with the total anisotropic volume occupied by the ensemble in solution (transparent spheres). The complete EOM results (model volume fractions, models, etc) are included in the full-entry zip archive.
|
|
 s, nm-1
 Rg, nm
![Static model image Filaggrin-like protein OTHER [STATIC IMAGE] model](/media//pdb_file/SASDJS7_fit1_model1.png)