|
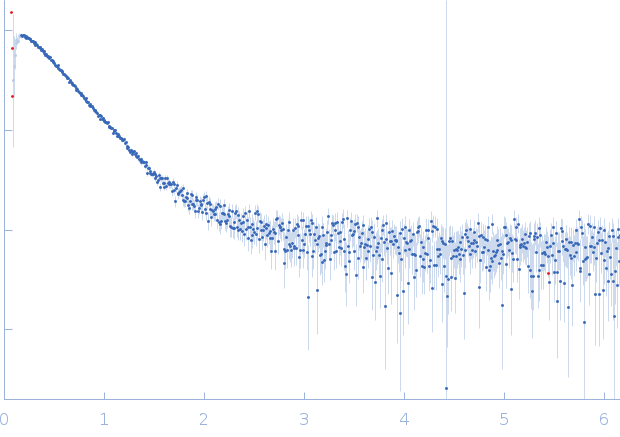
SAXS data from solutions of Harpin HrpZ2 protein in 10 mM MES, 100 mM NaF, pH 6.2 were collected using a Rigaku BioSAXS 2000 instrument at the Centre for Cellular & Molecular Biology (CCMB; Hyderabad, India) equipped with a Rigaku HyPix-3000 hybrid pixel array detector at a sample-detector distance of 0.5 m and at a wavelength of λ = 0.154178 nm (I(s) vs s, where s = 4πsinθ/λ, and 2θ is the scattering angle). Solute concentrations ranging between 1 and 4 mg/ml were measured at 22°C. Six successive 300 second frames were collected. The data were normalized to the intensity of the transmitted beam and radially averaged; the scattering of the solvent-blank was subtracted.
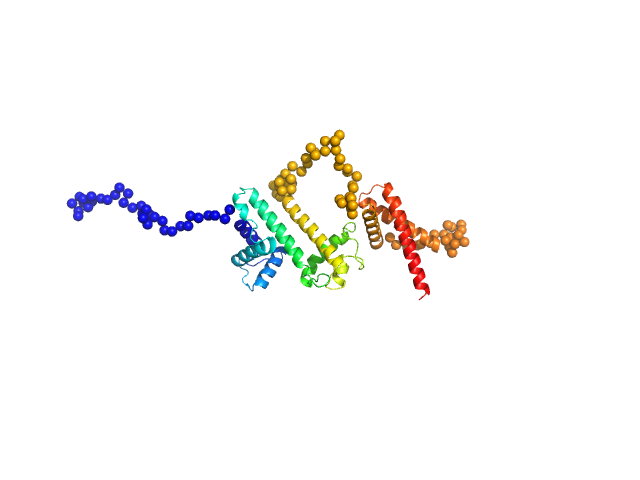
Different concentrations of protein was used: 1, 2 and 4 mg/ml. Blank buffer (10 mM MES, pH 6.2, 100 mM NaF) was run along with. Best result came with 1 mg/ml which showed the above values for a monomer protein. The spheroidal shape of the protein was oblate (flat). The molecular weight = 38.8 kD calculated from Vc (volume of correlation) method was most close to theoretical monomeric molecular weight (36.75 kD) of the N-terminal his tagged protein as compared to other methods.
Note: For 2 mg/ml concentration (not shown here), tendency of protein to form oligomer can be seen due to rise in Dmax (11.4 nm) from 8.77 nm (for 1 mg/ml concentration).
|
|
Harpin Z2
(HrpZ2)
|
| Mol. type |
|
Protein |
| Organism |
|
Pseudomonas syringae strain MTCC 11950 |
| Olig. state |
|
Monomer |
| Mon. MW |
|
36.8 kDa |
| Sequence |
|
FASTA |
| |
|
 s, nm-1
